Order Flow Charts and Analysis for Beginners
Understanding trading effectively involves more than just price movements. For traders seeking a deeper grasp of market dynamics, order flow analysis offers valuable insights by highlighting real-time activity in a clear, actionable way. This article introduces beginners to the specifics of charts, discusses their advantages and limitations critically, and illustrates why specialized software like ATAS is beneficial.
Decoding Charts
An order flow chart visually displays executed buy and sell orders at particular prices over specific time intervals. Unlike conventional candlestick or bar charts, these charts directly reflect trader activity, clearly showing areas of aggressive buying or selling through detailed order flow data. For instance, if numerous buy orders cluster consistently at a certain price, it suggests significant buying interest and potential support, which traders can rely on with greater confidence.
The Mechanics
The essence is analyzing the actual traded volume rather than historical price data alone. Traders interpret order flow by identifying patterns like increased buyer activity at support or high selling volumes at resistance points. This direct, volume-driven approach gives traders an accurate representation of sentiment and trader behavior, offering a significant advantage over lagging indicators.
However, it’s critical to recognize that interpreting order flow analytics isn’t always straightforward. Markets are dynamic, and sudden large orders can occasionally mislead traders by giving false signals of trend strength. Thus, combining order flow with other indicators or contextual analysis remains important.
Advantages and Limitations of Order Flow Analysis
Order flow provides several distinct advantages:
- Real-time insight: Offers immediate feedback on market behavior, improving responsiveness in decision-making.
- Clarity in volume trends: Precisely identifies key areas of activity, confirming genuine support or resistance levels.
- Enhanced risk management: Recognizing significant shifts in market activity helps traders better manage their risks and trade sizing.
Despite these strengths, there are limitations to consider:
- Complexity for beginners: Charts can initially appear complex, potentially overwhelming beginners.
- False signals: Large orders or temporary liquidity changes can occasionally misrepresent market sentiment.
- Market noise: Short-term fluctuations in order activity might not always signal meaningful trends, requiring trader discretion.
Why Specialized Software Is Essential
Generic trading platforms often lack the precision and detailed visualization required to effectively interpret your analysis. This is where specialized solutions like order flow analysis software by ATAS become essential.
ATAS specifically caters to traders seeking detailed insights, standing out among the best order flow trading software available, particularly for beginners due to its user-friendly design and powerful analytical tools.
Key ATAS features:
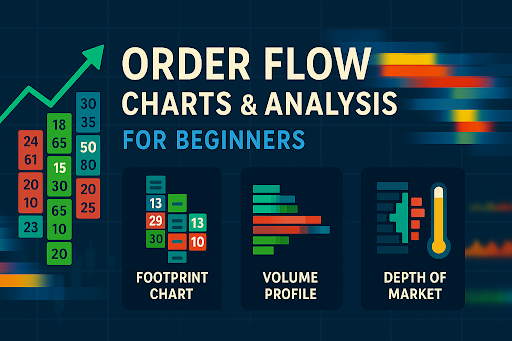
- Footprint charts: Display executed trade volumes at every price level clearly, helping identify market aggression easily.
- Volume profile: Aggregates data visually, quickly highlighting significant market zones and critical activity levels.
- Depth of market (DOM): Provides an accurate view of market liquidity and order book dynamics, enabling clearer anticipation of market movements.
Practical Applications and Critical Considerations
Beginners might initially struggle with interpreting the detailed data provided by trading software. Nevertheless, practical applications can streamline the learning curve significantly:
- Identifying genuine market strength: Use consistent, substantial volumes at support or resistance to confirm your trades, reducing reliance on subjective interpretation.
- Detecting market reversals: Sudden changes, especially around critical price levels, can signal potential market reversals with better accuracy.
- Improving trade entries: React to real-time shifts in market behavior, placing orders based on actual trader activity rather than assumptions.
Yet, beginners should be cautious and avoid overly relying on short-term fluctuations. Order flow should complement broader market analysis to avoid misinterpretation and false signals.
Getting Started with Analysis
Effective use of analytics requires quality software like ATAS and dedicated practice. Beginners should start slowly, gradually becoming familiar with various chart features and data interpretations. Practice consistently in simulated trading environments before transitioning to live markets, developing confidence in interpreting data accurately.
Integrating analysis into your trading practice offers distinct advantages, particularly in accurately interpreting market dynamics and managing trading risks. Specialized software like ATAS significantly enhances this process, providing reliable and detailed market insights. However, successful analysis requires critical thinking and careful interpretation, ensuring that traders use this powerful tool effectively without being misled by market noise.


