SCHD vs VOO: A Comprehensive Analysis for Long-Term Wealth Building Success

Choosing between SCHD and VOO represents one of the most common dilemmas facing long-term investors today. Both exchange-traded funds offer low costs and proven track records, yet they take fundamentally different approaches to building wealth.
VOO has delivered higher historical returns at 15.62% annually over the past decade compared to SCHD’s 12.87%, making it the stronger choice for total wealth accumulation, while SCHD offers higher current income through its 3.38% dividend yield for investors prioritizing cash flow.
The decision between these two funds depends on your investment timeline, income needs, and risk tolerance. VOO tracks the S&P 500 Index with 500 holdings across all sectors, while SCHD focuses on just 100 dividend-paying companies with at least 10 years of consistent payments.
This structural difference creates distinct performance profiles, tax implications, and portfolio behaviors that affect your long-term results.
Understanding how these ETFs compare across multiple dimensions will help you make an informed choice aligned with your financial goals.
From expense ratios and volatility to tax efficiency and rebalancing strategies, each characteristic plays a role in determining which fund fits your situation best.
Comparing Fund Structures
SCHD tracks a dividend-focused index of 100 U.S. companies, while VOO replicates the entire S&P 500 with 500 holdings. The funds use different methodologies that result in distinct portfolio compositions and risk profiles.
SCHD Overview
SCHD is a dividend fund tracking the Dow Jones U.S. Dividend 100 Index. This passively managed ETF focuses on high-quality dividend-paying stocks that meet specific fundamental criteria.
The fund screens companies based on dividend growth history, payout ratios, return on equity, and cash flow to total debt. These quality filters create a concentrated portfolio of 100 holdings compared to broader market indexes.
SCHD charges an expense ratio of 0.06%, making it cost-effective for long-term investors. The fund rebalances quarterly and reconstitutes annually to maintain its quality dividend focus.
VOO Overview
VOO is an S&P 500 fund tracking the S&P 500 Index with 500 large-cap U.S. companies. The fund provides market-cap weighted exposure to the broad U.S. equity market.
Your investment in VOO captures the performance of America’s largest publicly traded companies across all sectors. The fund uses full replication, holding all 500 stocks in the index at their market weights.
VOO charges an expense ratio of 0.03%, among the lowest available for equity funds. This passive approach requires minimal trading activity, keeping tracking error and costs low.
Index Tracking Differences
The two funds don’t share a single top-10 holding, reflecting fundamentally different construction methodologies. VOO’s top holdings include technology giants with lower dividend yields, while SCHD emphasizes established dividend payers.
SCHD’s quality screens exclude many high-growth companies, resulting in sector profiles that are near-opposites. You’ll find SCHD overweight in financials, consumer staples, and healthcare, while VOO has heavier technology and communication services exposure.
The concentration difference means SCHD carries higher single-stock risk with 100 holdings versus VOO’s 500. This creates different volatility patterns and correlation to market movements.
Portfolio Composition Analysis
SCHD concentrates on dividend-paying U.S. companies with strong fundamentals, while VOO tracks the entire S&P 500 index. These different approaches create distinct holdings, sector allocations, and company size distributions that directly impact your investment returns and risk profile.
Top Holdings and Sector Exposure
SCHD holds approximately 100 U.S. stocks selected for dividend quality and sustainability. Your top holdings typically include companies like Merck, PepsiCo, Cisco Systems, and Chevron. The fund emphasizes financial services, consumer staples, healthcare, and energy sectors.
VOO holds all 500 companies in the S&P 500 index. Your largest positions include technology giants like Apple, Microsoft, Amazon, and Nvidia. Information technology represents roughly 30% of the fund, followed by financials, healthcare, and consumer discretionary sectors.
Key sector differences:
- Technology: VOO allocates 28-32% to tech versus SCHD’s 5-8%
- Financials: SCHD typically holds 18-22% versus VOO’s 12-14%
- Consumer Staples: SCHD maintains 15-18% versus VOO’s 6-8%
- Energy: SCHD allocates 8-12% versus VOO’s 3-5%
SCHD’s sector tilt toward dividend-paying industries means you sacrifice growth-oriented tech exposure for income stability.
Market Capitalization Weighting
VOO uses market-cap weighting where larger companies receive proportionally bigger allocations in your portfolio. This means your investment heavily favors mega-cap companies worth over $200 billion. The top 10 holdings represent approximately 32-35% of the fund.
SCHD employs a modified weighting system that limits individual position sizes to roughly 4% maximum. This creates more balanced exposure across your 100 holdings. The fund focuses on large-cap and mid-cap companies with proven dividend track records.
Your SCHD investment provides more equal weighting compared to VOO’s concentration in the largest market-cap stocks. This reduces your exposure to any single company’s performance but also limits participation in mega-cap growth.
Geographic Focus
Both ETFs invest exclusively in U.S.-based companies. VOO tracks American corporations across all sectors regardless of where they generate revenue. Many S&P 500 companies earn substantial international income, giving you indirect global exposure.
SCHD similarly holds only domestic stocks but selects companies with domestic-focused business models and reliable U.S. dividend histories. Your international exposure through SCHD remains limited compared to VOO’s holdings of multinational corporations.
Neither fund provides direct investment in foreign markets or emerging economies. You would need additional international ETFs to diversify beyond U.S. equity markets.
Long-Term Performance Insights
VOO has delivered 13.1% average annual returns compared to SCHD’s 11.1% over the past decade, but SCHD demonstrated superior downside protection during market downturns. Understanding these performance characteristics helps you align your investment choice with your financial goals and risk tolerance.
Historical Returns
VOO has outperformed SCHD in total returns over the long term, with a 13.1% annualized return compared to SCHD’s 11.1%. This 2% annual difference compounds significantly over time, creating a substantial wealth gap for growth-focused investors.
The performance gap exists primarily because VOO tracks the entire S&P 500, including high-growth technology companies that have driven market returns. SCHD focuses exclusively on dividend-paying companies with strong fundamentals, which naturally excludes many high-growth stocks.
Recent data shows 1-year returns of 28.99% for SCHD versus 29.91% for VOO, indicating relatively similar recent performance. Your total return calculation must include both price appreciation and dividend reinvestment to accurately compare these funds.
Volatility and Risk Metrics
SCHD exhibits lower volatility than VOO due to its focus on established, dividend-paying companies. This reduced volatility means you’ll experience smaller price swings during both market rallies and declines.
Your portfolio’s standard deviation matters because it affects your ability to stay invested during turbulent periods. SCHD’s quality-focused screening process selects companies with stable cash flows, which naturally reduces price fluctuation.
Beta measurements show SCHD typically has a lower beta than VOO, meaning it’s less sensitive to overall market movements. This characteristic makes SCHD more suitable if you’re approaching retirement or have a lower risk tolerance.
Drawdown Analysis
SCHD lost only 3% when VOO dropped 18% in 2022, demonstrating its defensive characteristics during bear markets. This stark difference in drawdowns illustrates how dividend-focused strategies can protect your capital during downturns.
Maximum drawdown analysis reveals SCHD’s value and quality factors provide cushioning when growth stocks sell off aggressively. Your portfolio preservation during market stress allows you to avoid panic selling and maintain your long-term investment plan.
Recovery time from drawdowns also differs between these funds, with SCHD typically requiring less time to return to previous highs after corrections. This quicker recovery stems from the fund’s focus on profitable, financially stable companies that weather economic uncertainty better than speculative growth stocks.
Dividend Growth and Yield Considerations
SCHD offers a dividend yield around 3.41%, which is roughly three times higher than VOO’s current yield. The dividend growth rate for SCHD stands at approximately 10.43% annually, nearly double that of VOO.
Current Yield Comparison
VOO currently yields between 1% and 1.5% as it tracks the full S&P 500 index. This lower yield reflects the fund’s broad market exposure, which includes growth-oriented companies that prioritize reinvestment over dividend payments.
SCHD’s yield sits at 3.41%, making it attractive for investors seeking immediate income. This higher yield comes from SCHD’s focus on dividend-paying companies exclusively. The fund specifically targets established businesses with strong cash flows that consistently return capital to shareholders.
The yield difference matters most for your investment timeline. If you need current income, SCHD’s higher yield provides more immediate cash flow. If you’re focused on total return and don’t need income now, VOO’s lower yield may be less relevant to your strategy.
Dividend Growth Rates
SCHD demonstrates dividend growth of 10.43% annually, outpacing VOO’s dividend growth rate. This faster growth stems from SCHD’s methodology of selecting companies with proven dividend increase histories.
Your dividend income from SCHD compounds more quickly over time. A higher growth rate means your income stream accelerates faster, which becomes significant over decades of investing. This growth rate reflects the underlying companies’ commitment to returning increasing amounts of cash to shareholders.
VOO’s dividend growth follows the broader S&P 500, which includes many non-dividend-paying companies. While still positive, the growth rate is tempered by the inclusion of companies that don’t prioritize dividend increases.
Payout Consistency
SCHD requires companies to maintain 10 consecutive years of dividend payments before inclusion in the index. This screening process filters out less stable businesses and focuses your investment on companies with demonstrated resilience through market cycles.
VOO includes any S&P 500 company regardless of dividend history. Some holdings pay no dividends at all, while others have irregular payment patterns. This creates less predictability in your dividend income stream.
The consistency difference affects your planning capabilities. With SCHD, you can better forecast future income because the underlying companies have proven track records. VOO’s dividends fluctuate more based on the overall composition and performance of the S&P 500.
Expense Ratios and Management Fees
VOO charges 0.03% annually while SCHD costs 0.06%, making VOO half the price to own. Both funds remain significantly cheaper than most actively managed funds, and the difference between them translates to measurable impacts on your long-term returns.
Cost Efficiency
VOO’s 0.03% expense ratio means you pay $3 per year for every $10,000 invested. SCHD’s 0.06% fee equals $6 annually on the same investment amount.
The difference appears minimal in dollar terms, but both funds rank among the most cost-efficient options available. The industry average expense ratio sits at 0.25%, making both ETFs substantially cheaper than typical mutual funds and actively managed portfolios.
Annual Cost Comparison:
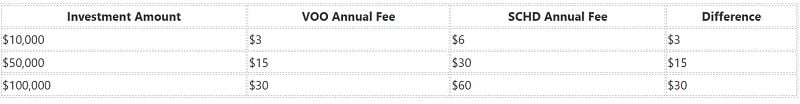
Impact on Total Return
The 0.03% cost difference compounds over decades of ownership. On a $100,000 investment held for 30 years with 8% annual returns, VOO’s lower fees save you approximately $2,500 compared to SCHD.
This gap widens as your portfolio grows. Your actual returns get reduced by these fees before you see them, so lower expenses directly boost your wealth accumulation. While SCHD’s higher fee reflects its dividend-focused screening process, the cost still eats into your returns year after year.
Tax Efficiency and Implications
Both ETFs generate taxable events through dividends and capital gains, but the timing and tax treatment differ based on their distribution strategies. Your after-tax returns depend on which type of income each fund generates and how frequently distributions occur.
Dividend Taxation
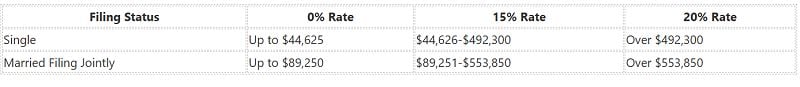
SCHD distributes higher dividend income with a current yield around 3.5%, while VOO typically yields between 1.3-1.5%. Most dividends from both funds qualify as qualified dividends, taxed at preferential rates of 0%, 15%, or 20% depending on your income bracket.
If you hold these ETFs in a taxable account, you’ll owe taxes on dividends in the year you receive them. SCHD’s higher dividend yield means you’ll pay more taxes annually, which reduces your ability to compound returns. This creates a tax drag that compounds over time.
Qualified Dividend Tax Rates by Income (2026):
Capital Gains Distributions
VOO demonstrates superior tax efficiency because most of its returns come from unrealized capital appreciation rather than distributed income. You control when to recognize gains by choosing when to sell shares.
SCHD’s active rebalancing to maintain its dividend-focused strategy can trigger capital gains distributions. These distributions occur when the fund sells appreciated securities, passing the tax liability to shareholders even if you didn’t sell any shares yourself.
Both ETFs use in-kind redemptions to minimize capital gains distributions, but VOO’s passive strategy requires less portfolio turnover. This structural advantage allows you to defer taxes until you sell, letting your investment compound without annual tax interference on appreciation.
Risk Factors and Volatility Profiles
VOO typically exhibits higher volatility due to its tech-heavy exposure, while SCHD demonstrates more stability through its dividend-focused strategy. SCHD lost just 3% when VOO dropped 18% in 2022, highlighting the meaningful differences in how these ETFs respond to market downturns.
Market and Sector Risks
VOO carries concentration risk in technology and growth sectors, which can amplify losses during market corrections. The S&P 500’s heavy weighting toward tech companies means you’ll experience greater price swings when these sectors face headwinds. Interest rate increases and regulatory challenges particularly impact these growth-oriented holdings.
SCHD focuses on dividend-paying stocks with reduced volatility, but this creates different vulnerabilities. You face sector concentration in financials, consumer staples, and healthcare. Rising interest rates can pressure dividend stocks as investors shift to bonds for income.
Economic recessions affect both ETFs differently. VOO suffers from sharper declines as growth stocks contract rapidly. SCHD’s established, cash-generating companies typically weather downturns better but may experience slower recoveries.
Diversification Benefits
VOO provides exposure to 500 large-cap U.S. companies across all sectors, giving you broad market diversification. You own stakes in technology, healthcare, financials, consumer discretionary, and industrials in proportion to their market capitalizations. This breadth reduces single-company risk but doesn’t eliminate sector concentration.
SCHD holds approximately 100 dividend-paying stocks selected for quality and sustainability metrics. Your portfolio becomes more defensive with lower correlation to market swings. However, you sacrifice exposure to high-growth sectors and smaller position counts increase individual stock impact.
Key differences in diversification:
- VOO offers wider sector representation with 500+ holdings
- SCHD provides concentrated quality exposure to income producers
- VOO tracks market-cap weights; SCHD uses fundamental screening
Suitability for Different Investor Profiles
VOO typically serves investors prioritizing long-term capital appreciation and market-cap-weighted exposure, while SCHD appeals to those seeking current income and quality dividend growth. Your investment timeline, income needs, and risk tolerance determine which fund aligns better with your financial goals.
Growth-Oriented Investors
VOO provides direct exposure to the S&P 500’s total return potential, including high-growth technology companies like Apple, Microsoft, and Nvidia that dominate the index. If you’re under 50 and focused on wealth accumulation rather than current income, VOO’s structure aligns with your goals.
The fund’s lower dividend yield of 1.1% means more of your returns come from price appreciation rather than distributions. This concentration in growth sectors has historically delivered stronger total returns over extended periods.
VOO has outperformed SCHD with approximately 13.1% annualized returns versus 11.1% over the past decade. That performance gap translates to roughly $5,500 more on a $10,000 investment over ten years.
Your tax situation also matters. Since VOO generates less dividend income, you’ll face lower annual tax bills in taxable accounts, allowing more capital to compound over time.
Income-Focused Investors
SCHD delivers a 3.4% dividend yield, making it suitable if you need regular cash flow from your portfolio. The fund screens for dividend quality, sustainability, and growth rather than simply chasing the highest yields.
You receive quarterly distributions that can supplement retirement income or other cash needs. SCHD’s focus on established, profitable companies with strong balance sheets provides more stability during market downturns.
The fund’s holdings include defensive sectors like consumer staples, healthcare, and financials rather than high-growth technology. This composition resulted in just a 3% decline during 2022’s bear market compared to broader market losses.
If you’re within 10 years of retirement or already retired, SCHD’s income characteristics and lower volatility profile better match your risk tolerance. The growing dividend stream also provides some inflation protection over time.
Passive vs. Active Approaches
Both funds follow rules-based strategies, but they differ in complexity. VOO uses pure market-cap weighting of S&P 500 constituents, requiring minimal screening or selection decisions.
SCHD applies multiple quality filters including dividend growth history, cash flow to debt ratios, return on equity, and dividend yield. This screening process creates a more concentrated portfolio of approximately 100 holdings versus VOO’s 500.
Key Strategy Differences:
- VOO: Tracks market performance automatically through cap-weighting
- SCHD: Actively screens for quality factors within dividend-paying stocks
- Rebalancing: VOO adjusts with market movements; SCHD reconstitutes quarterly
You’ll find VOO offers better beginner suitability with a score of 9.5 versus 9 for SCHD due to its simpler structure. If you prefer a straightforward core holding without additional complexity, VOO’s passive approach requires less monitoring and understanding of dividend metrics.
Accessibility and Liquidity
Both ETFs trade on major exchanges with minimal barriers to entry, though VOO maintains a slight edge in daily trading activity. Neither fund requires a minimum investment beyond the price of a single share.
Trading Volumes
VOO trades with substantially higher daily volume than SCHD. VOO typically sees over 5 million shares change hands daily, while SCHD averages around 2-3 million shares per day. This difference reflects VOO’s longer market presence and its status as one of the largest ETFs by assets under management.
Higher trading volume benefits you through tighter bid-ask spreads. VOO’s spread typically ranges from $0.01 to $0.02, while SCHD’s spread usually stays between $0.01 and $0.03. These minimal differences won’t materially impact your returns unless you’re making frequent trades or executing very large orders.
Both ETFs provide sufficient liquidity for most investors. You can buy or sell either fund during market hours without difficulty or significant price impact.
Minimum Investment Requirements
You can start investing in either ETF with the cost of a single share. VOO trades around $400-450 per share, while SCHD typically trades between $25-30 per share. This makes SCHD more accessible if you have limited capital or want to dollar-cost average with smaller amounts.
Many brokerages now offer fractional shares, which eliminates this distinction entirely. You can invest any dollar amount in either fund, regardless of the share price. This feature makes both ETFs equally accessible whether you have $50 or $50,000 to invest.
Rebalancing Strategies and Portfolio Integration
Combining SCHD and VOO requires attention to allocation drift and complementary asset positioning. Your rebalancing frequency and asset class mix will determine your portfolio’s risk-adjusted returns over time.
Blending With Other Asset Classes
SCHD and VOO both represent U.S. equity exposure, so blending them with bonds, international stocks, and real estate investment trusts creates better diversification. A typical allocation might include 60% between these two ETFs, 20% bonds, 15% international equities, and 5% REITs.
You can use SCHD as your dividend-focused equity allocation while VOO serves as your growth-oriented core holding. This approach captures both income and capital appreciation without significant overlap, though both funds share many holdings.
Consider your existing tax-advantaged accounts when placing these ETFs. VOO works well in taxable accounts due to minimal distributions, while SCHD fits better in Roth IRAs where qualified dividends won’t create additional tax burdens during accumulation years.
Periodic Rebalancing Considerations
Dollar-cost averaging and dividend reinvestment help compound returns while reducing market timing risk. You should rebalance when your allocation drifts 5% or more from your target, typically once or twice per year.
Annual rebalancing in December offers tax-loss harvesting opportunities and simplifies record-keeping. Quarterly rebalancing may reduce volatility but increases transaction costs and creates more taxable events in non-retirement accounts.
Set specific thresholds rather than calendar dates. If your SCHD allocation grows from 30% to 36% of your portfolio, sell the excess and redirect it to underweighted positions. This disciplined approach forces you to sell high and buy low without emotional decision-making.
Conclusion
Your choice between SCHD and VOO depends on your specific financial goals and investment timeline. VOO provides broad market exposure through 500 companies and typically delivers higher total returns over extended periods. SCHD focuses on dividend-paying stocks and offers a stronger dividend yield for investors seeking regular income.
Key factors to consider:
- Income needs: SCHD generates higher current income through dividends
- Growth potential: VOO historically delivers greater capital appreciation
- Diversification: VOO holds more companies across all sectors
- Tax efficiency: VOO produces less taxable dividend income annually
If you’re in the accumulation phase and decades away from retirement, VOO’s growth-oriented approach aligns well with long-term wealth building. You can reinvest dividends automatically and benefit from compound growth across the entire S&P 500.
If you need income now or plan to retire within 10 years, SCHD’s dividend-focused strategy provides more cash flow. The ETF concentrates holdings in established companies with proven track records of dividend payments.
Both ETFs charge low expense ratios and have demonstrated strong performance. You can also hold both in your portfolio to balance growth and income objectives. Allocate a higher percentage to whichever ETF matches your primary investment goal, whether that’s maximizing returns or generating steady cash flow.